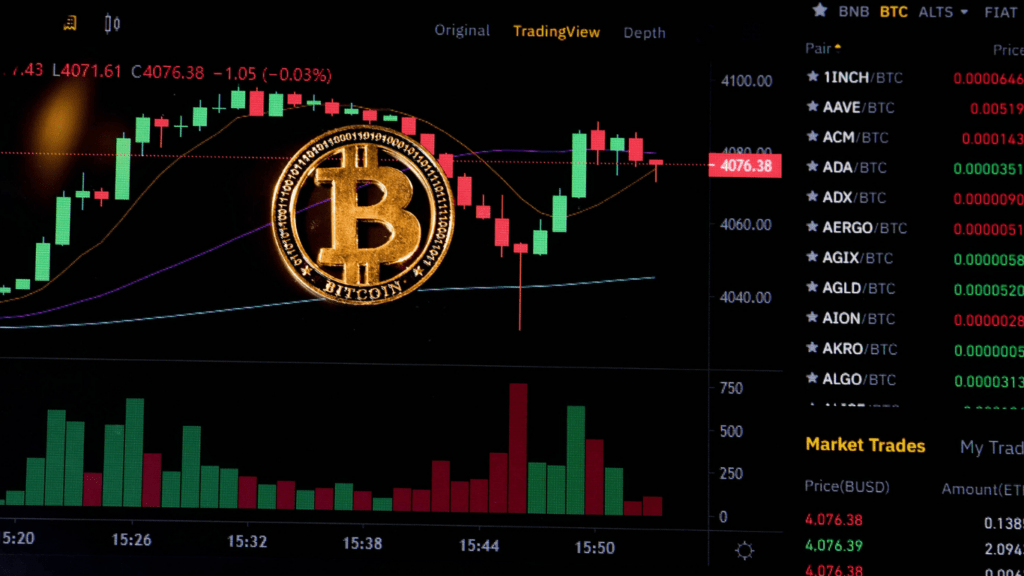
Timing is everything in trading, and finding the right entry point can make all the difference. I’ve often seen traders struggle with when to jump into a trade, only to watch the market move against them. That’s where technical indicators like RSI (Relative Strength Index) and MACD (Moving Average Convergence Divergence) come into play.
Understanding RSI and MACD
RSI and MACD are two widely-used technical indicators in trading. Each offers unique insights into market conditions and can complement one another when analyzing potential entry points.
What Is RSI?
RSI, or Relative Strength Index, measures the speed and change of price movements. It’s expressed as a value between 0 and 100. Traders use RSI to identify overbought (above 70) or oversold (below 30) conditions in the market.
For example, an RSI reading above 70 might suggest a stock is overbought, signaling a potential downside reversal. Conversely, a reading below 30 could indicate oversold conditions, where prices may rebound. By tracking RSI levels, I assess market momentum and gauge whether the current trend is likely to continue or reverse.
What Is MACD?
MACD, or Moving Average Convergence Divergence, shows the relationship between two exponential moving averages (EMAs). It’s calculated by subtracting the 26-period EMA from the 12-period EMA. The MACD line is paired with a signal line, which is the 9-period EMA of the MACD itself, to identify potential buy or sell signals.
When the MACD line crosses above the signal line, it generates a bullish signal, suggesting upward momentum. If the MACD crosses below the signal line, it indicates bearish sentiment and potential price declines. Traders also analyze the MACD histogram, which represents the difference between the MACD and signal lines, to interpret shifts in momentum strength.
The Importance Of Entry Points In Trading

Entry points play a critical role in trading success. Precise timing can significantly impact profitability and risk management.
Why Precision Matters
Accurate entry points can enhance reward-to-risk ratios. Entering a trade at the right time ensures minimal exposure to adverse market movements while maximizing potential gains. For example, buying during oversold conditions indicated by RSI or during a MACD bullish crossover may result in better price levels and reduced risks.
Inaccurate timing often increases drawdowns and reduces profit margins. Even a small delay in executing a trade can lead to higher costs or missed opportunities. By focusing on precision, I can align with favorable market conditions and limit unnecessary losses.
Common Mistakes Traders Make
- Relying on single indicators can lead to poor decision-making.
- Traders sometimes depend solely on RSI or MACD without considering the broader market context. For instance, entering a trade based only on an RSI value of 30 might fail if the market trend remains bearish.
- Ignoring confirmation signals often results in false entries.
- A trader might act on an initial MACD crossover without waiting for momentum confirmation from the histogram or volume data.
- Additionally, emotional trading, such as entering too early out of fear of missing out, can lead to losses.
How RSI And MACD Work Together
RSI and MACD complement each other by combining momentum analysis and trend detection. Together, they provide a clearer picture of market dynamics, improving the accuracy of entry decisions.
Complementary Indicators
RSI focuses on identifying overbought or oversold conditions by analyzing price momentum, while MACD evaluates trend direction and strength using moving averages. Their integration leverages the strengths of both, reducing the risk of false signals. For example, when RSI indicates oversold conditions and MACD confirms bullish momentum through a signal line crossover, the probability of a successful entry increases.
Identifying Overbought And Oversold Conditions
RSI helps pinpoint overbought zones above 70 and oversold zones below 30. MACD confirms the validity of these signals by aligning crossovers with RSI levels. For instance, an oversold RSI paired with a bullish MACD crossover suggests a likely upward price movement, helping me confidently time entries.
Spotting Divergences
Divergences occur when price trends differ from indicator movements, signaling potential reversals. A bearish divergence happens if prices reach a higher high, but RSI or MACD forms a lower high. Pairing both indicators minimizes false positives. For example, if both RSI and MACD confirm a divergence, it’s a stronger reversal signal, enhancing entry precision.
Strategies For Using RSI And MACD For Smarter Entry Points
Effective use of RSI and MACD requires strategic application to increase accuracy in trade entries. Focusing on:
- confluence
- combining setups
- adapting settings
to market conditions can refine performance.
Timing Entries With Confluence
I rely on confluence between RSI and MACD signals to validate trade entries. When RSI reaches an extreme value, like overbought above 70 or oversold below 30, I look for confirmation through a MACD crossover. For instance, an oversold RSI aligning with a bullish MACD crossover strengthens the case for a long position. Using multiple indicators together filters out noise and reduces false signals.
Combining RSI Zones With MACD Crossovers
I combine RSI zones with MACD crossovers to pinpoint strategic entry points. When RSI exits its overbought or oversold range, I evaluate the MACD histogram and line crossover to confirm momentum. For example, if RSI rises from oversold while the MACD line crosses above the signal line, I interpret this as increasing bullish momentum. This dual-layer strategy provides better insights into trend reversals and continuation patterns.
Adjusting Settings For Different Markets
I adjust RSI and MACD settings to suit varying market dynamics. In high-volatility markets like cryptocurrencies, I find shorter RSI periods like 7 or 10 more responsive for quick reversals. For MACD in trending markets, I prefer slower settings, such as 12, 26, and 9, for smoother trend confirmation. Customizing these parameters improves compatibility with each market’s specific behavior and conditions.


 Crypto Trends Reporter

