Trading can feel like navigating a maze, but candlestick patterns are the map that helps me make sense of the market. These patterns, formed by price movements over a specific time frame, reveal valuable insights into market sentiment and potential trends. They’re like a language traders use to interpret what’s happening and predict what might come next.
What Are Candlestick Patterns?
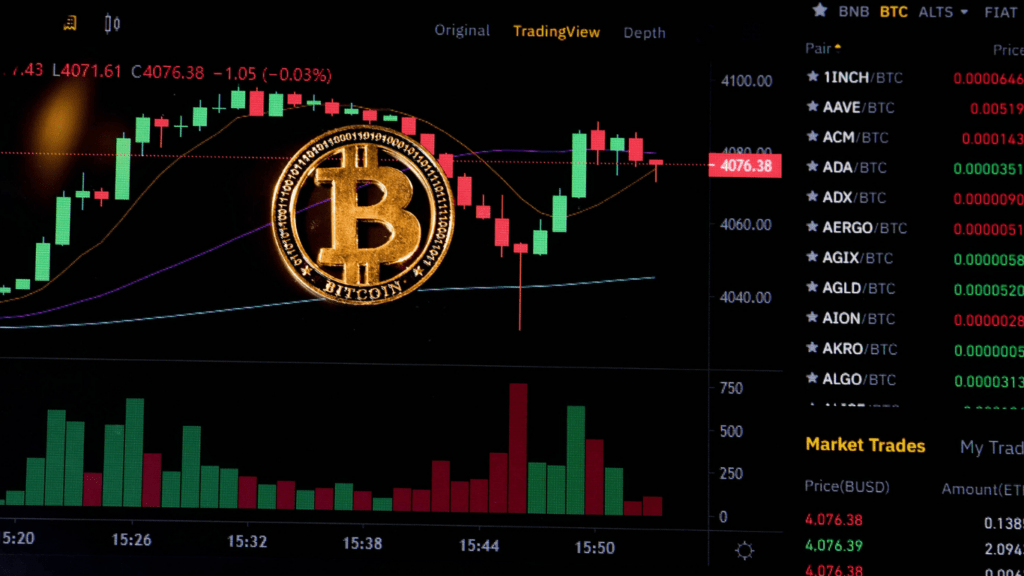
Candlestick patterns are visual representations of price movements over a specific time period. Each candlestick provides four key pieces of information: the opening price, closing price, high, and low within that timeframe. These patterns combine individual candlesticks into formations that signal potential market trends or reversals.
Originating from Japanese rice traders in the 18th century, candlestick patterns have become a cornerstone of technical analysis. They help traders interpret market sentiment by illustrating the battle between buyers and sellers. Patterns like:
- Hammer
- Doji
- Engulfing
tell unique stories about market conditions, making them essential for developing trading strategies. There are two primary categories: reversal patterns and continuation patterns. Reversal patterns indicate a potential change in the price direction, whereas continuation patterns suggest the current trend is likely to persist. By analyzing these formations, I identify entry and exit points, time trades effectively, and better predict market behavior.
Why Candlestick Patterns Matter In Trading
Candlestick patterns play a critical role in analyzing market behavior because they visually represent price dynamics. These patterns reveal the interaction between buyers and sellers over specific timeframes, enabling traders to interpret sentiment changes quickly. Understanding these shifts is essential to anticipate future price directions.
By using candlestick patterns, I can identify potential trend reversals and continuations with greater accuracy. For example, patterns like the Hammer or Shooting Star often signal reversals, while patterns such as Rising Three Methods indicate a continuation of the current trend. This insight helps in timing entry and exit points effectively.
Candlestick patterns also enhance decision-making in volatile markets. When markets are uncertain, formations like the Doji or Spinning Top highlight indecision, allowing me to pause rather than make impulsive trades. This ensures a more disciplined trading approach.
Incorporating candlestick analysis into my strategy improves overall accuracy. These patterns complement other technical tools like moving averages or RSI, creating a more comprehensive view of the market. Mastering them provides an edge by translating raw price data into actionable insights.
Basic Candlestick Patterns
Candlestick patterns simplify the interpretation of price action and help in predicting market movements. Among the basic patterns, the Doji, Spinning Top, and Marubozu hold significant importance.
1. Doji
A Doji forms when the opening and closing prices are nearly identical, resulting in a small or nonexistent body. Its slender shape highlights market indecision. Common types include Neutral Doji, often seen during consolidation, and Dragonfly Doji, signaling potential reversal when appearing at support or resistance levels.
2. Spinning Top
The Spinning Top has a small body with long upper and lower wicks, reflecting balanced market forces. A frequent occurrence during sideways markets, it signals reduced momentum or indecision. For instance, post-trend Spinning Tops might indicate potential reversals, especially when paired with volume analysis.
3. Marubozu
A Marubozu features no wicks, with the body fully representing the price range. Bullish Marubozu, with open near the low and close at the high, signifies strong buying momentum. Conversely, a bearish Marubozu, opening near the high and closing near the low, suggests dominance by sellers.
Bullish Candlestick Patterns
Bullish candlestick patterns signal potential upward reversals, giving traders insight into upcoming buying momentum. Recognizing these patterns can enhance my ability to time entry points effectively.
1. Bullish Engulfing
A bullish engulfing pattern occurs when a smaller bearish candle is followed by a larger bullish candle that fully engulfs it. The first candle indicates selling pressure, while the second represents a strong shift to buying momentum. This pattern frequently appears at the bottom of downtrends, signaling the possibility of a trend reversal. I look for significant volume increase accompanying this formation to confirm its validity.
2. Morning Star
The morning star consists of three candles: a bearish candle, a small-bodied indecision candle (often a Doji or Spinning Top), and a large bullish candle. This pattern suggests the market is transitioning from bearish to bullish sentiment. When I see this formation near a support level, it typically indicates a strong buying opportunity. Confirming factors include volume spikes or breaks of resistance levels.
3. Hammer
The hammer features a small body near the top of its range and a long lower wick, showing a rejection of lower prices during a session. It forms after a bearish trend and indicates potential reversal as buyers regain control. I rely on the hammer’s context—whether it appears near key support levels—and confirmations like higher closing prices in subsequent sessions to evaluate its strength.
4. Piercing Line
The piercing line pattern consists of two candles: a bearish one followed by a bullish one that opens below the previous close and closes above the midpoint of the prior bearish candle. This formation highlights a strong buying reaction during a price drop. When I observe sufficient volume and the pattern near support zones, I identify an upcoming bullish shift.
Bearish Candlestick Patterns


Bearish candlestick patterns signal potential downward reversals, helping traders identify opportunities to exit trades or short the market. These patterns reflect shifts in market sentiment from bullish to bearish.
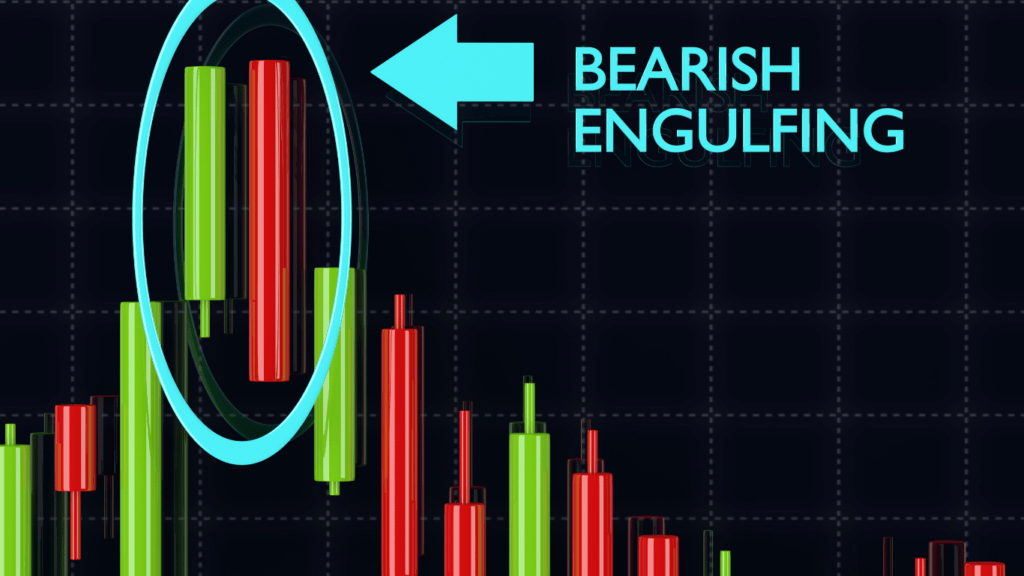
1. Bearish Engulfing
The Bearish Engulfing pattern consists of a small bullish candle followed by a larger bearish candle that completely engulfs the first. This pattern forms during an uptrend, indicating a potential reversal as selling pressure overtakes buying momentum. I pay close attention to the second candle’s size since a significant body confirms stronger bearish sentiment.
2. Evening Star
The Evening Star features a three-candle formation: a large bullish candle, a small indecisive candle (like a Doji), and a large bearish candle that closes well into the first candle’s body. It appears at the end of an uptrend, signaling a loss of upward momentum and a likely trend reversal. When analyzing this pattern, I focus on its position and the volume increase during the bearish close for validation.
3. Shooting Star
The Shooting Star forms during an uptrend and has a small real body near the candle’s lower end with a long upper wick. It shows that buyers pushed prices higher but sellers regained control, leading to a weak close. I rely on additional confirmation, like subsequent bearish candles or resistance levels, before interpreting it as a solid reversal signal.
4. Dark Cloud Cover
The Dark Cloud Cover pattern consists of two candles: a bullish first candle and a bearish second candle that opens above the first but closes below its midpoint. This pattern indicates increasing selling pressure and a potential downtrend. I often use relative strength indicators or volume spikes to confirm its validity in weaker market conditions.
 Crypto Trends Reporter