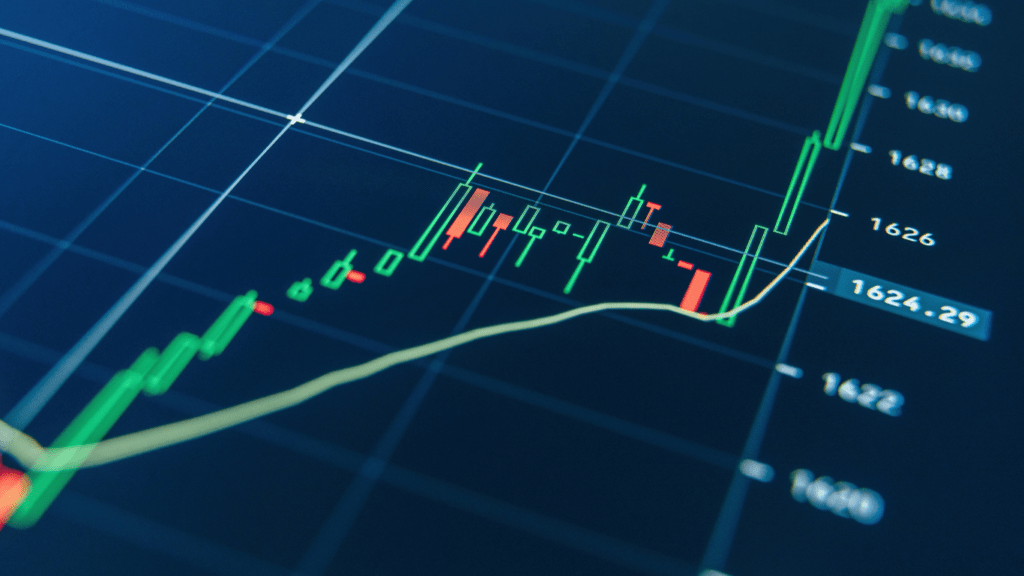
Crypto trading can feel like navigating uncharted waters, especially with its volatile nature and constant price swings. When I first dove into this world, I quickly realized relying on instinct alone wasn’t enough. That’s where technical indicators come into play—they’re like a compass, helping traders make sense of market trends and potential price movements.
Understanding Technical Indicators
Technical indicators use historical market data to provide insights into price trends and potential future movements. In crypto trading, these tools are essential for formulating strategies based on data-driven analysis.
What Are Technical Indicators?
Technical indicators are mathematical calculations applied to price, volume, or open interest data. These indicators are categorized into trending, momentum, volatility, and volume-based tools. For example, moving averages (MA) are trending indicators, while the Relative Strength Index (RSI) measures momentum. They help traders identify patterns and assess the market’s current state by analyzing past performance.
Importance of Technical Indicators in Crypto Trading
Technical indicators improve decision-making by offering a structured analysis of market behavior. With high market volatility, traders gain an advantage by interpreting signals like overbought or oversold conditions using indicators like Bollinger Bands or RSI. They assist in planning entry and exit points, minimizing risks associated with unpredictable price swings.
Key Types of Technical Indicators
Technical indicators fall into several categories, each providing specific insights to help traders analyze crypto market movements. These groups include:
- trend
- momentum
- volume
- volatility indicators
Trend Indicators
Trend indicators highlight the market’s overall direction over a specific period. They assist in identifying whether prices are in an uptrend, downtrend, or consolidating. Moving Averages (MA), such as Simple Moving Average (SMA) and Exponential Moving Average (EMA), are commonly used. For instance, a 50-day SMA smooths out price data over 50 days, helping traders see long-term trends. MACD (Moving Average Convergence Divergence) is another tool that combines trend and momentum analysis to generate crossover signals.
Momentum Indicators
Momentum indicators measure the speed and strength of price movements. These tools are useful for identifying overbought or oversold conditions. Relative Strength Index (RSI) ranges from 0 to 100, with values above 70 indicating overbought conditions and below 30 signaling oversold levels. Stochastic Oscillator is another momentum tool, comparing an asset’s current price to its range over a set period.
Volume Indicators
Volume indicators examine trading volumes to confirm price trends or detect reversals. These tools validate price movements by analyzing market participation. For example, On-Balance Volume (OBV) accumulates volume data, showing whether volume supports the current trend. Chaikin Money Flow (CMF) assesses buying and selling pressure based on volume and closing price.
Volatility Indicators
Volatility indicators assess price fluctuation magnitudes, helping traders measure market instability. Tools like Bollinger Bands plot standard deviation bands above and below an asset’s MA, visually representing volatility levels. Average True Range (ATR) provides numerical insights into market volatility, helping traders set stop-loss orders and pinpoint exit points.
Benefits Of Using Technical Indicators in Crypto Trading

Using technical indicators in crypto trading enhances analytical precision and decision-making. These tools enable traders to identify patterns, anticipate movements, and craft strategies aligned with market conditions.
Identifying Market Trends
Technical indicators help me analyze market trends by assessing price directions over time. Trend indicators, such as the Moving Average (MA) and Moving Average Convergence Divergence (MACD), reveal whether the market is bullish or bearish. For example, when an upward trend emerges, I use these indicators to confirm its strength before making trades.
Timing Entry and Exit Points
- Precise entry and exit timing determine trading success.
- Momentum indicators, like the Relative Strength Index (RSI) and Stochastic Oscillator, highlight overbought or oversold conditions.
- I rely on these signals to pinpoint optimal buy and sell opportunities, ensuring I capitalize on price movements without unnecessary delays.
Managing Risks Effectively
Technical indicators provide valuable risk management insights. Volatility tools, such as Bollinger Bands and the Average True Range (ATR), help me assess price fluctuation ranges. For instance, I set stop-loss levels based on volatility indicators to limit potential losses during high-price instability periods.
Tips for Effective Use of Technical Indicators
Using technical indicators effectively can enhance decision-making in crypto trading. Applying a strategic and adaptive approach helps maximize their benefits while minimizing risks.
Combining Multiple Indicators
I use multiple indicators to get a comprehensive market view. For instance, pairing a trend indicator like MACD with a momentum indicator such as RSI identifies both market direction and overbought or oversold conditions. Volume indicators, like OBV, confirm trends, while volatility tools, such as Bollinger Bands, assess risk levels. Combining complementary indicators reduces noise and increases signal accuracy, avoiding dependence on a single tool.
Aligning Indicators with Trading Strategies
I select indicators aligning with my trading goals. Short-term traders rely on fast responding tools like Stochastic Oscillator, while long-term investors prefer smoother trends from SMA or EMA. For example, I integrate volatility indicators to manage stop-loss placements in a high-risk environment, ensuring my strategy accommodates current market conditions. Matching indicators to trading objectives streamlines analysis and improves consistency in execution.
Regularly Reviewing and Adjusting Approaches
I review my indicator setup regularly to ensure alignment with market behavior. For example, I adjust settings like moving average timeframes during periods of rising volatility or incorporate additional tools to address new trends. Frequent reviews enhance adaptability, allowing me to refine strategies when market conditions shift. This proactive adjustment minimizes errors caused by outdated assumptions or ineffective tools.


 Market Analyst & Trading Strategist

