Cryptocurrency trading can feel like navigating uncharted waters, but technical analysis offers a reliable compass. By identifying key patterns, traders can make informed decisions rather than relying on guesswork. It’s like unlocking a secret language that markets speak every day.
What Is Crypto Technical Analysis?
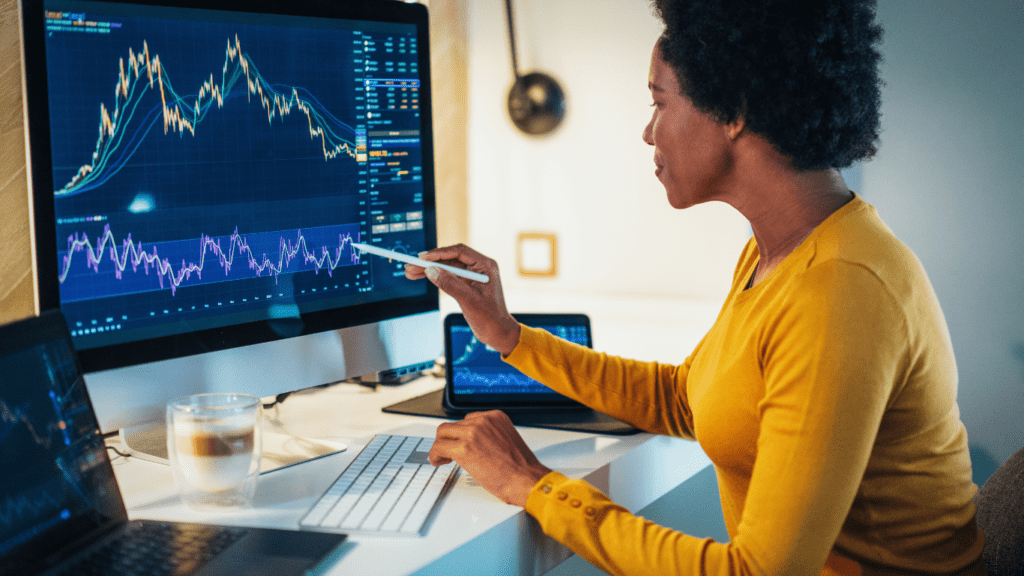
Crypto technical analysis examines historical price data and trading volumes to predict future market behavior. It relies on charts and quantitative methods rather than fundamental factors like a project’s utility or team.
I use technical indicators such as moving averages, RSI (Relative Strength Index), and MACD (Moving Average Convergence Divergence) to identify trends and potential entry or exit points. These tools analyze market patterns, measure momentum, or signal changes in price direction.
Chart patterns like head and shoulders, triangles, and double tops help me anticipate market movements. For instance, a head and shoulders pattern might indicate a potential reversal in an uptrend. Recognizing these formations provides opportunities to act before shifts occur.
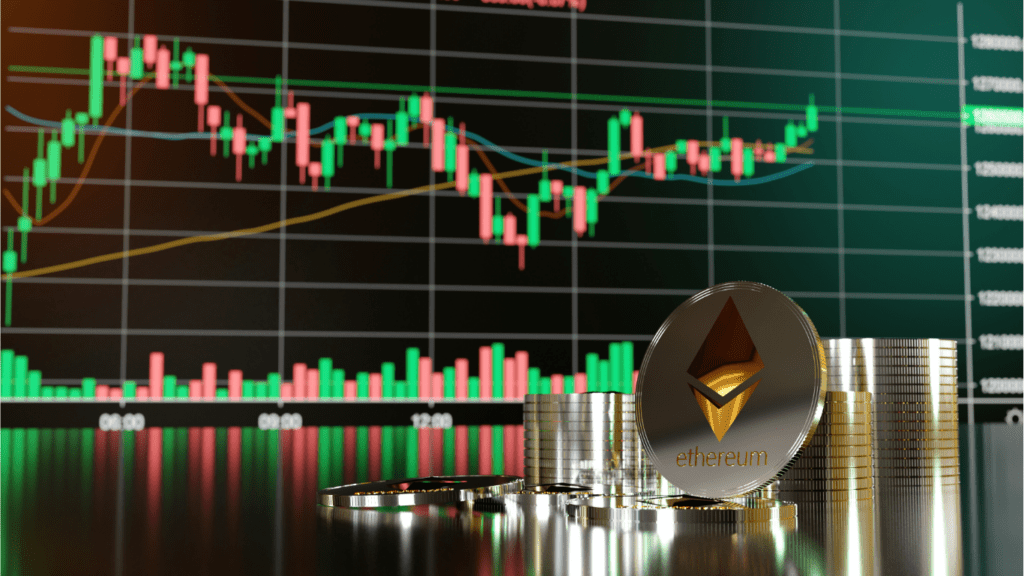
In crypto, volatility adds importance to technical analysis. Unlike traditional markets, crypto often experiences rapid price swings, so studying patterns becomes essential for timing important decisions.
Importance Of Key Patterns In Crypto Trading
Key patterns play a critical role in analyzing and predicting price movements in the crypto market. These patterns provide insights into potential future trends by identifying recurring market behaviors based on historical data. Understanding them enhances decision-making by offering a structured approach to interpreting chart data.
Recognizing common patterns such as:
- bull flags
- pennants
- double tops
aids traders in identifying trend continuations or reversals. For instance, a bull flag suggests continued upward momentum, while a double top often signals a potential price reversal. These signals enable traders to act with greater confidence in volatile conditions.
Patterns also help traders gauge market sentiment. Bullish formations like ascending triangles often reflect increasing buying interest, while bearish patterns like descending triangles indicate selling pressure. Awareness of these shifts ensures trades align more accurately with market momentum.
Applying key patterns in combination with technical indicators, such as RSI or MACD, strengthens analysis further. When patterns corroborate indicator signals, it increases the probability of accurate predictions, reducing reliance on speculation. Clear comprehension of these patterns is vital for maintaining a competitive edge in the dynamic world of crypto trading.
Key Patterns To Know In Crypto Technical Analysis
Recognizing key patterns is integral to successful crypto trading. These patterns serve as a foundation for identifying market behavior and crafting effective strategies.
Support And Resistance Levels
Support and resistance levels are the price points where buying or selling pressure outweighs the other, causing a reversal or pause in market direction. Support acts as a floor, preventing prices from falling further, while resistance serves as a ceiling that stops prices from rising. For example, if Bitcoin repeatedly bounces from $30,000, that level represents strong support. Traders monitor these levels to plan entry or exit points, as breaks above resistance or below support often signal significant market moves.
Trend Lines
Trend lines visually represent the prevailing market direction, connecting consecutive highs in a downtrend or lows in an uptrend. These lines provide traders with a straightforward way to identify trends and forecast future movements. If the price of Ethereum consistently adheres to an upward trend line, it suggests strong bullish momentum. Conversely, repeated failure to break a descending line implies bearish sentiment. I incorporate trend lines to confirm support and resistance zones or identify breakout opportunities.
Head And Shoulders
The head and shoulders pattern signals an impending trend reversal. It forms with three peaks: a higher central peak (the head) flanked by two lower and equal ones (the shoulders). In a bearish variant, the pattern predicts a downward reversal, often breaking below the “neckline,” which connects the troughs. For instance, a head and shoulders formation in Litecoin near significant resistance could indicate a price decline. I combine this pattern with volume analysis, as higher volume during breakdowns signals greater reliability.
Double Tops And Bottoms
Double tops and bottoms are reversal patterns formed after two unsuccessful attempts to break resistance or support, respectively. Double tops resemble an “M” shape, indicating a bearish reversal, while double bottoms have a “W” shape, marking a bullish shift. If Solana repeatedly fails to breach $24, forming a double top, traders might consider selling positions. I look for confirmation through increased trading volume or subsequent breaks of key levels to validate these patterns.
Flags And Pennants
Flags and pennants indicate trend continuation after a short consolidation period. Flags resemble rectangular shapes, while pennants appear as small symmetrical triangles. Both form after sharp price movements, known as “poles.” A breakout above a bullish flag in Binance Coin suggests a resumption of the upward trend. I use these patterns to spot entry points aligned with prevailing market direction and verify with volume spikes during breakouts.
Fibonacci Retracement
Fibonacci retracement identifies potential support and resistance levels based on predefined ratios derived from Fibonacci sequences, such as 23.6%, 38.2%, 50%, and 61.8%. Traders use these levels to find possible reversal or continuation points. Suppose Bitcoin retraces to the 61.8% level after a rally; this area might act as support. I use retracement alongside other indicators to verify its significance and anticipate rebounds or reversals with higher confidence.
Tools And Resources For Identifying Patterns
Identifying patterns effectively requires the use of reliable tools and resources. These tools analyze price data, chart patterns, and trading volumes to improve precision in technical analysis.
- Charting Platforms: Platforms like TradingView and MetaTrader provide advanced charting tools for analyzing crypto price movements. They offer customizable indicators, drawing tools, and real-time data for comprehensive pattern identification.
- Technical Indicators: Indicators such as RSI, MACD, and Bollinger Bands highlight trends and potential reversals. Tools like these allow me to confirm chart patterns and refine entry or exit decisions.
- Data Aggregators: Websites like CoinMarketCap or Glassnode aggregate historical data, offering insights into market trends and metrics like trading volume and liquidity that support pattern analysis.
- Educational Resources: Online courses, webinars, and forums like Investopedia or Binance Academy deepen understanding of technical patterns. I explore these resources to improve analytical skills and stay updated.
- Automation Tools: Algorithm-based tools like CryptoHopper or TrendSpider automate pattern detection using AI-powered analysis, helping save time and avoid manual inaccuracies.
- Community Inputs: Platforms like Reddit and crypto-specific Discord groups provide real-time discussions and pattern-sharing insights from other traders, supplementing my analyses.
Using these tools and resources enhances my ability to spot and interpret patterns, improving decision-making for crypto trading.
Tips For Effective Technical Analysis In Crypto
1. Understand the Crypto Market’s Volatility
Crypto markets experience frequent price swings. I focus on shorter timeframes for identifying trends, as these changes occur rapidly compared to traditional financial markets.
2. Use Multiple Timeframes
Analyzing several timeframes provides a broader perspective. I combine daily, 4-hour, and 1-hour charts to assess both long-term trends and short-term price movements.
3. Combine Indicators with Patterns
Relying solely on chart patterns can limit accuracy. I pair indicators like RSI, MACD, and Bollinger Bands with patterns, ensuring that my analysis is supported by quantitative data.
4. Focus on Volume Analysis
Trading volume reflects the strength of a trend. A rising volume during price increases indicates momentum, so I monitor volume spikes to validate breakouts or breakdowns.
5. Identify Market Sentiment
Sentiment influences price behavior. I track bullish or bearish formations along with qualitative data such as news or macroeconomic events to anticipate potential market reactions.
6. Backtest and Paper Trade
Testing strategies on historical data helps assess reliability. I paper trade on simulated accounts to refine my technical analysis before risking actual capital.
7. Set Entry, Exit, and Stop-Loss Points
Predefined price levels help avoid impulsive decisions. I determine my entry, profit target, and stop-loss levels based on trend lines or Fibonacci levels to manage risk effectively.
7. Stay Consistent with Tools
Familiarity with specific analysis tools promotes precision. I stick to platforms like TradingView and MetaTrader to ensure consistency in charting and technical studies.
7. Constantly Learn and Adapt
The crypto market evolves rapidly. I regularly update my technical analysis approach by studying new patterns or indicators and staying informed through educational platforms and trading communities.
 Founder & Blockchain Visionary