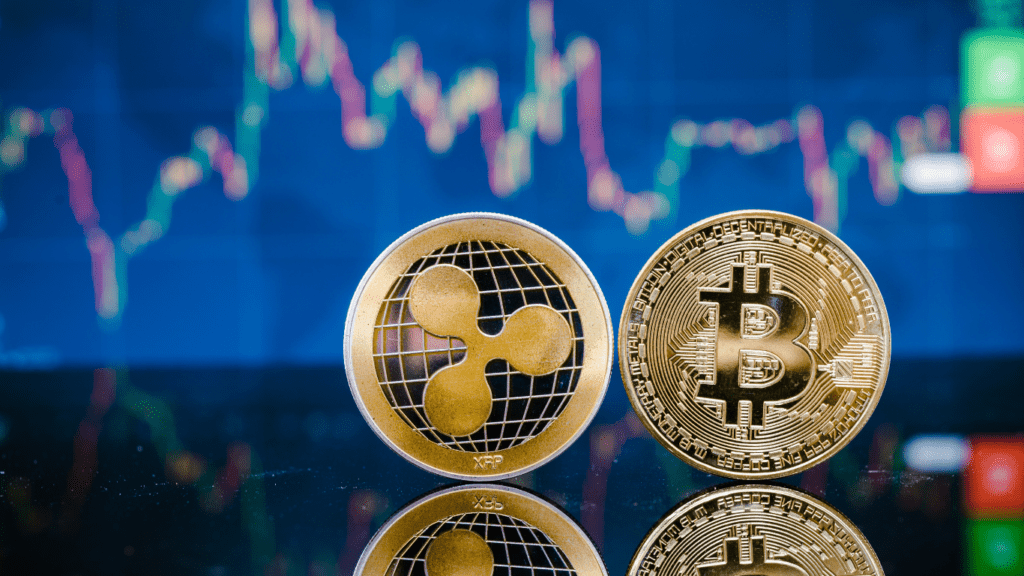
Price Action: Still the First Signal
In the constantly shifting world of crypto, price action remains the most immediate and accessible indicator for traders. Especially in high volatility environments, understanding how to read daily and weekly chart patterns is essential for navigating market swings and identifying trade setups.
Why Chart Patterns Matter in Crypto Volatility
Unlike traditional markets, crypto trades 24/7 with fewer protective regulatory measures. That makes technical analysis not just useful but critical.
Higher volatility requires faster analysis: Intraday and swing traders need to read trends in real time
Market ‘noise’ can mislead: Focusing on broader patterns (like weekly setups) helps separate signals from sudden spikes or dumps
Historic patterns often rhyme: Crypto tends to repeat certain behaviors near tops, bottoms, and key levels
Key Price Action Elements to Track
To make the most of price action analysis, keep your eye on the following core components:
Key Levels
Support and resistance zones: Look for areas where price repeatedly stalls or reverses
Psychological price points: Round numbers like $30,000 for BTC or $2,000 for ETH often act as magnets or strong barriers
Candlestick Formations
Reversal patterns: Watch for pin bars, engulfing candles, and doji formations on the daily or weekly chart
Continuation patterns: Flags, pennants, and trends supported by volume confirm strength or weakness in the move
Trend Reversal Zones
Analyze ‘lower highs’ in an uptrend or ‘higher lows’ in a downtrend
Combine with momentum indicators (RSI, MACD) to increase conviction
Compare across timeframes watching the 1D, 3D, and 1W setups together often paints the clearest picture
Final Thought
While the crypto space is saturated with new data and flashy indicators, price action remains the first signal for a reason it reflects trader behavior in real time. Learning to read and react to these patterns can provide a powerful edge, especially when markets get unpredictable.
On Chain Metrics Worth Monitoring
When it comes to understanding the crypto market from the inside out, on chain data offers invaluable insights. Rather than relying solely on price movements, savvy investors look directly at blockchain activity to assess market health, investor behavior, and potential trend shifts.
Key Metrics to Track
To stay ahead in 2026, keep a close watch on these vital on chain indicators:
Wallet Activity
Track the growth of active addresses to spot rising adoption or market exits
Sudden spikes often suggest increased participation or panic selling
HODL Ratios
Long Term Holder metrics show how much of the coin supply hasn’t moved in months or years
A rising HODL ratio typically signals strong hands and potential market bottoms
Exchange Flows
Large inflows to centralized exchanges may indicate incoming sell pressure
Outflows to cold wallets or DeFi can signal long term accumulation
Whale Watching: Real Time Movement
Major holders or whales can shift the market with a single transaction. Analyzing their behavior provides unique foresight:
Monitor wallets with significant holdings for sudden shifts
Use blockchain explorers and analytics platforms to flag unusual activity
Track large transactions to or from known exchange wallets for clues about intent
Advanced Metrics: NVT Ratio and Beyond
The Network Value to Transactions (NVT) Ratio functions like a price to earnings (P/E) ratio for crypto:
High NVT may suggest overvaluation if price rises without corresponding network activity
Low NVT could indicate undervaluation and a coming price rebound
Other useful on chain ratios:
Market Value to Realized Value (MVRV)
Stock to Flow (S2F) for Bitcoin
Active Addresses vs. Price Divergence
Use These Metrics in Context
On chain data is powerful but it’s not infallible. The key to getting meaningful signals is to combine metrics and view them within broader market context rather than relying on one data point in isolation.
Look for confluence across multiple indicators
Pair on chain data with technical indicators and sentiment shifts
Use real time alerts from platforms like Glassnode, CryptoQuant, and Santiment for quick insights
Sentiment Analysis and Social Signals
Crypto doesn’t move on numbers alone. It moves on emotion often whipped up, amplified, or reversed in real time by platforms like Reddit, Twitter (now X), and Telegram. These channels aren’t just where news drops. They’re where narratives form, FOMO escalates, and panic spreads.
Reddit’s crypto subs shape retail consensus. Twitter sets the speed of news and speculation, often acting as the first spark for coins to trend. Telegram, with its semi private groups, often incubates hype or doubt before it spills into the public sphere.
To track this, traders now rely on tools that scrape and scan these platforms for sentiment cues measuring how positive, anxious, or downright delusional the community is getting. Platforms like Santiment, LunarCrush, and The Tie pull insights like volume of bullish mentions or sudden spikes in project chatter to spot when sentiment is too hot (or too cold).
But reading signals from these channels takes more than numbers. It’s about tone, timing, and context. Is hype being driven by influencer copy paste pumps? Is fear based on actual fundamentals or just recycled FUD?
The smart move: stay plugged in, but not consumed. Watch how the crowd reacts not just what they say. Herd behavior often speaks louder than the herd itself.
Dominance and Altcoin Season Index

If there’s one chart every crypto trader checks religiously, it’s BTC dominance. When Bitcoin gains a larger share of the total crypto market cap, it usually tightens the flow of capital into altcoins. High BTC dominance? That’s generally bad news for your small cap moonshot bags. Low dominance, on the other hand, often marks the start of an altcoin rally.
Enter the ETH/BTC ratio and Altseason Index two tools that help clarify when the altcoin tide might turn. ETH/BTC rising means traders are rotating into Ethereum instead of Bitcoin, which can be a leading signal for broader alt momentum. Combined with the Altseason Index a gauge measuring whether altcoins are outperforming BTC you get a sharper picture of where the energy is.
The key isn’t just watching these signals it’s knowing when they flash green. An ETH/BTC breakout paired with a BTC dominance drop below 45% often opens the door to altcoin rallies. But context matters. A weak macro environment or shaky sentiment can kill a run short.
Smart traders pair these indicators with real time chart action and on chain trends. Timing alt rotations isn’t just data it’s rhythm. But having these tools in your arsenal cuts the guesswork and keeps your plays grounded in market flows.
Institutional Movement and Macro Correlation
Big money moves markets, and crypto is no exception. ETF flows, especially around Bitcoin and Ethereum, act like spotlights when they surge, so does attention, liquidity, and often price. Institutional entries and exits, whether from hedge funds, traditional asset managers, or sovereign level players, tend to signal the beginning of larger trends. Smart retail traders watch these flows like hawks.
But it’s not just about who’s buying or selling it’s also about the environment they’re operating in. Interest rates and inflation data remain core pillars. When the Fed tightens monetary policy, risk assets like crypto usually pull back. Looser conditions? Prices often climb. Regulatory changes can hit just as hard. A single SEC headline can send the market into rally mode or a tailspin.
Then there’s correlation. Sometimes crypto moves hand in hand with tech stocks. Other times, it breaks off completely. Knowing when crypto is tracking the Nasdaq and when it’s doing its own thing can help traders avoid false signals and time entries better. The key is context. Zoom out. Look at the bigger picture. The macro currents often tell you where the crypto tides are heading.
Powerful Indicators for Bitcoin Specific Trends
Timing the Bitcoin market isn’t about guessing it’s about tracking the right signals. Platforms like Glassnode and CryptoQuant are leading the pack when it comes to crunching on chain data into readable trends. These tools decode the deeper flows of BTC by analyzing what really moves the needle: holder behavior, miner activity, and cyclical pressure points.
Two key metrics to know: Long Term Holder SOPR and Miner Outflow. SOPR (Spent Output Profit Ratio) for long term holders tracks whether BTC is moving at a profit. When this ratio dips below 1, it means holders are capitulating and selling at a loss not a bad time to start watching for accumulation signals. Miner Outflow, on the other hand, tells you when miners are sending BTC to exchanges often a sell signal. Big spikes can foreshadow price drops, especially when paired with weak sentiment or low buying pressure.
Want to take it further? Bookmark this breakdown of bitcoin trend indicators. Whether you’re swing trading or long term stacking, keeping these metrics on your radar keeps you ahead of the noise.
Making Signals Work for You
Understanding crypto indicators is powerful but interpreting them wisely is what separates smart investors from reactive ones. The 2026 market won’t reward over reliance on charts or emotion alone. The best strategy? Find the balance between data, intuition, and timing.
Data vs. Gut Feel: Striking the Right Balance
Too much data can overwhelm even seasoned traders. Instead of tracking every single metric available, focus on:
A core set of reliable charts and indicators you understand well
Your personal trading style and risk tolerance
Practicing discipline over emotional reactions to every market dip or surge
Tip: Trust your setup. Once you have a system that works, stick to it even when noise tempts you to deviate.
Avoiding Analysis Paralysis
The crypto market operates non stop, leading many to feel like they need to react constantly. This mindset leads to burnout and costly mistakes.
To stay in control:
Set time windows to analyze the market don’t be glued to charts 24/7
Use alerts and automation to minimize decision fatigue
Limit the number of indicators you check daily
Think in Confluence, Not in Isolation
One metric rarely tells the full story. Look for confluence, where multiple signals align before making your move.
What confluence looks like:
Price action confirming on chain strength (e.g., rising addresses + breakout pattern)
Bullish sentiment aligning with macro tailwinds (e.g., easing inflation + positive ETF news)
Awareness of cycles with confirmation from tools like SOPR or miner activity
Final Word
Indicators are tools not guarantees. Make them part of a broader picture, not the whole painting. And when in doubt, step back and review multiple sources before taking action.
For a breakdown of some of the most useful Bitcoin specific market indicators to track this year, check out this guide: Bitcoin Trend Indicators.
 Crypto Trends Reporter